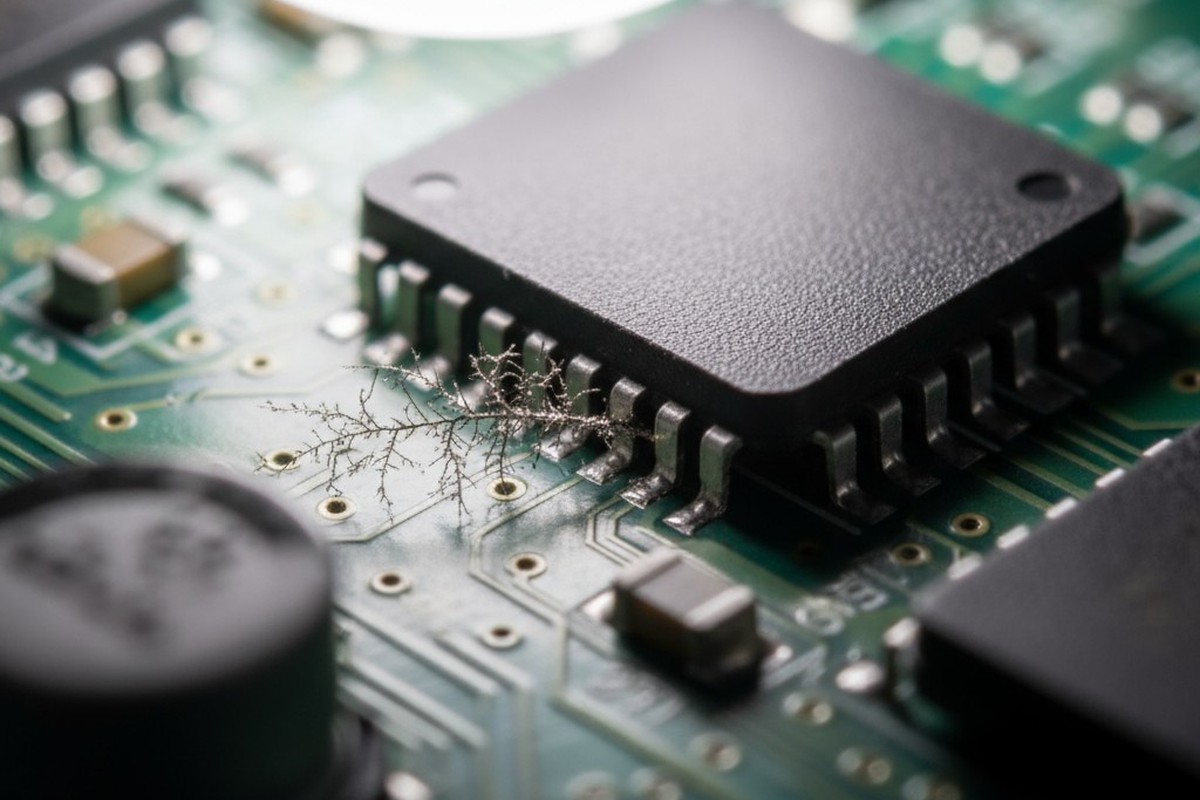
It’s a story we’ve heard countless times. A product passes every electrical test and quality check on the assembly line, shipping with a clean bill of health. Then, months later, the field failure reports start trickling in. Corrosion under a component. Unexplained current leakage. Dendritic growth shorting out adjacent pins.
The assembly looks clean. Your contract manufacturer shows you the passing ROSE test reports. Yet the failures are real, and they are costly. The problem isn’t your design or your components. It’s the test. You are being misled by a pretty number that masks a corrosive time bomb.
The Ghost in the Machine: When “Clean” Boards Fail in the Field
The disconnect between post-assembly testing and long-term reliability is one of the most frustrating challenges in electronics manufacturing. The culprit is almost always ionic contamination left over from the soldering process. These residues, invisible to the naked eye, are benign in a dry, controlled environment. But once a product is in the field, exposed to ambient humidity and temperature cycles, they become active.

This activation creates an electrolyte on the board’s surface, enabling a process called electrochemical migration. Metal ions travel across the board, forming delicate, crystalline structures called dendrites. These dendrites grow between points of different electrical potential until they create a short circuit. The result is a catastrophic, difficult-to-diagnose failure on a board that, by all conventional measures, was perfectly “clean.”
This isn’t a rare event. It is the predictable outcome of relying on an outdated and inadequate cleanliness metric.
Why the ROSE Test Is a Recipe for Disaster
For decades, the standard for ionic cleanliness has been the Resistivity of Solvent Extract (ROSE) test. It’s fast, cheap, and what most manufacturers are set up to do. At Bester PCBA, we believe it’s also dangerously misleading and a primary contributor to in-field reliability issues.
The test has two fundamental, fatal flaws.
The Flaw of Averages: How Good Numbers Hide Bad Spots
The ROSE test works by dunking an entire circuit board assembly into a solvent solution and measuring the overall change in the solvent’s resistivity. This gives you a single number representing the total average ionic contamination across the entire board.
This approach is profoundly flawed. A field failure isn’t caused by a uniform, low-level layer of contamination; it’s caused by a highly concentrated, localized hotspot of residue. The ROSE test’s averaging effect means a small, dangerously corrosive spot under a single component is completely diluted by the vast, clean expanses of solder mask. It’s like testing a swimming pool for poison by taking a single water sample—you will almost certainly miss the one lethal drop.
A passing ROSE score doesn’t mean your board is clean. It means it’s clean on average.
Blind Spots: What ROSE Can’t See Under BGAs and Dense Components

The second flaw is physical. Modern circuit boards are dense. Components like Ball Grid Arrays (BGAs), Land Grid Arrays (LGAs), and Quad-Flat No-leads (QFNs) have extremely low standoff heights, with clearances measured in mils. The solvent used in a ROSE test simply cannot flow into these tight spaces to dissolve the residues trapped underneath.
This is precisely where the greatest danger lies. During reflow, flux residues get trapped under the body of the component, right next to hundreds of tightly packed, current-carrying pads. The test solvent washes over the top, unable to penetrate these critical areas, and the report comes back clean. Meanwhile, the most corrosive contaminants are left undisturbed in the one place they can do the most damage. The ROSE test isn’t just averaging away the problem; it’s completely blind to it.
Debunking the “No-Clean” Myth: Your Biggest Source of Corrosive Residue
This reliance on inadequate testing is propped up by a pervasive industry myth: the idea of “no-clean” flux. Many engineers believe that using a no-clean flux means they don’t need to worry about cleaning or testing for residues. This misunderstanding of what “no-clean” actually means is a direct path to reliability problems.
What “No-Clean” Really Means (And What It Doesn’t)
“No-clean” does not mean the flux magically vaporizes and leaves zero residue. It means the post-reflow residues are designed to be chemically inert, but only if the board has gone through a perfect thermal profile. The activators in the flux are meant to be fully consumed and encapsulated during reflow.
In the real world of volume manufacturing, perfect thermal profiles are a rarity. Ovens have hot and cold spots. Board density and component mass create thermal shadows. As a result, the flux is often only partially activated, leaving behind unconsumed, reactive residues.
How Heat and Humidity Activate “Benign” Flux
These leftover no-clean residues are often hygroscopic, meaning they readily absorb moisture from the air. Once they absorb water, the “benign” residue becomes an active, acidic electrolyte. The very chemicals designed to clean oxides off the pads during soldering are now free to start corroding component leads and enabling dendritic growth.
Believing “no-clean” absolves you of verifying cleanliness is a gamble on achieving a perfect process every single time. At Bester PCBA, we don’t bet on perfection. We verify with data.
A Better Tool for the Job: Seeing the Unseen with Ion Chromatography
If ROSE testing is a blunt instrument, Ion Chromatography (IC) is a surgical tool. It moves beyond a simple pass/fail average to deliver a detailed chemical analysis of the board’s surface. It is the only method that provides the specific, actionable data needed to predict and prevent ionic-related field failures.
From a Single Number to a Chemical Fingerprint
 Report")
Unlike the ROSE test, an IC analysis doesn’t give you one number. It gives you a chromatogram, a report that identifies the specific ions present on the board and their precise concentrations. This is the difference between a doctor telling you “you have a fever” and one telling you “you have a specific bacterial infection, and here is the antibiotic to treat it.”
With IC, you can see the chemical fingerprint of your assembly process, distinguish between different types of contaminants, and trace them back to their source.
What IC Tells You That ROSE Can’t
The power of IC is its specificity. It answers critical questions that ROSE cannot. Is the contamination composed of weak organic acids from flux residue? This points to an incomplete reflow profile or an ineffective cleaning process. Are there high levels of chloride and sodium? This suggests a handling issue, contamination from gloves, or even problems with the PCB fabrication itself.
This level of detail transforms cleanliness testing from a simple quality gate into a powerful process control tool. You are no longer just checking a box; you are actively diagnosing and improving the long-term reliability of your product.
Building a Predictive Cleanliness Program That Works
Adopting Ion Chromatography is the first step. Using it correctly is what separates a world-class manufacturing process from the rest. A truly predictive program isn’t about random testing; it’s a targeted strategy based on risk. At Bester PCBA, our approach is built on three core principles.
1. Target Your Testing by Board Region
Stop testing the whole board, because risk isn’t evenly distributed. An IC test should use a localized extraction method to pull samples from the highest-risk areas: directly under that dense BGA, in the tight corners of your sensitive analog circuitry, and around low-standoff QFNs. By targeting the trouble spots, you get data that reflects the worst-case scenario, not the best-case average.
2. Correlate Contaminants to Your Flux Family
Work with your assembly partner to characterize your specific no-clean flux. Every flux family leaves a different ionic signature. By running a baseline IC test, you can establish what a “normal” residue profile looks like for your process. This allows you to set intelligent limits. Instead of a generic “zero tolerance” policy, you can set specific thresholds for the expected weak organic acids while maintaining a near-zero tolerance for harmful, unexpected ions like chlorides.
3. Normalize by Process Risk, Not Just Area
The final and most critical step is to stop thinking about contamination in simple terms of micrograms per square inch. This metric is almost meaningless without context. A high-voltage, fine-pitch analog component has an infinitely lower tolerance for ionic residue than a low-speed digital logic section.
A robust cleanliness specification doesn’t have one universal limit. It has multiple limits, normalized by the risk profile of each circuit area. The area around a 400V power supply requires a much higher level of cleanliness than the area around a 3.3V pull-up resistor. By mapping cleanliness requirements to electrical risk, you create a specification that directly prevents field failures.
Putting It Into Practice: Overcoming Real-World Hurdles
Transitioning to a modern cleanliness strategy requires more than changing a test method; it demands a shift in mindset and a pragmatic approach.
Addressing the Cost Question: IC as an Investment
The first objection to IC is always cost. Yes, a single IC test is more expensive than a single ROSE test, but this view is shortsighted. The true cost of inadequate testing is measured in RMAs, warranty claims, product recalls, and damage to your brand’s reputation.
Compare the cost of a comprehensive IC validation program during product development—perhaps a few thousand dollars—to the cost of a single field failure analysis, let alone a widespread recall. Ion Chromatography isn’t an expense. It’s one of the highest-return investments you can make in the long-term success of your product.
How to Push Your Contract Manufacturer Beyond ROSE
Many contract manufacturers are comfortable with their legacy ROSE testing equipment. Pushing for a more rigorous method requires a collaborative, data-driven approach. Start small. Instead of demanding IC for every board in production, specify it on a sample basis during NPI.
Provide your CM with a clear map of the high-risk board regions you want tested. Share this article with them. Frame the conversation not as a lack of trust, but as a shared commitment to building a more reliable product. The best manufacturing partners will welcome the opportunity to improve their process and demonstrate their capability. If they resist, it may be a sign that their definition of “quality” isn’t aligned with yours.


")


