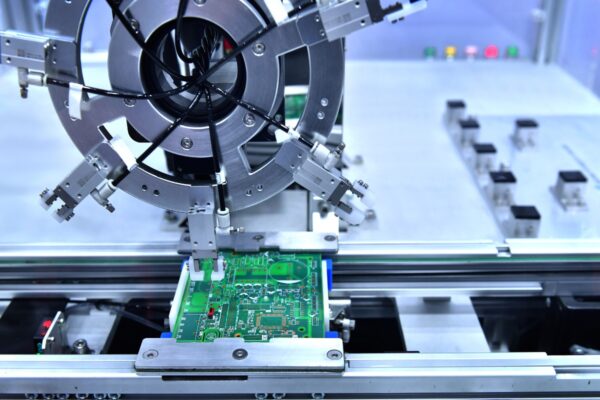
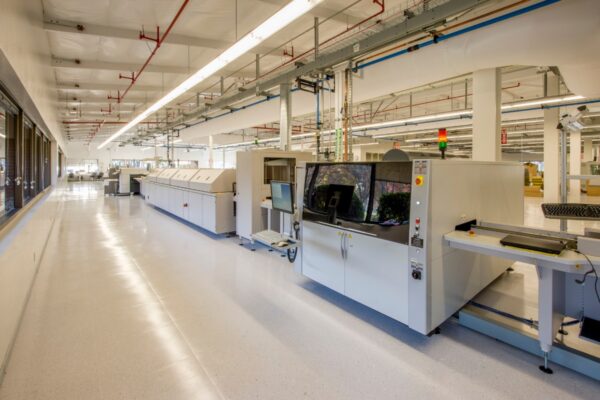
Every new product introduction follows a predictable script. The board design is locked. The stencil is cut. The components are kitted. Then the reflow profiling begins, and a week vanishes. Engineers chase the textbook ramp-soak-spike curve, iterating through oven runs, adjusting zone temperatures in quarter-degree increments, and watching tombstoned passives and cold solder joints pile up. The launch date slips. The cycle repeats on the next project.
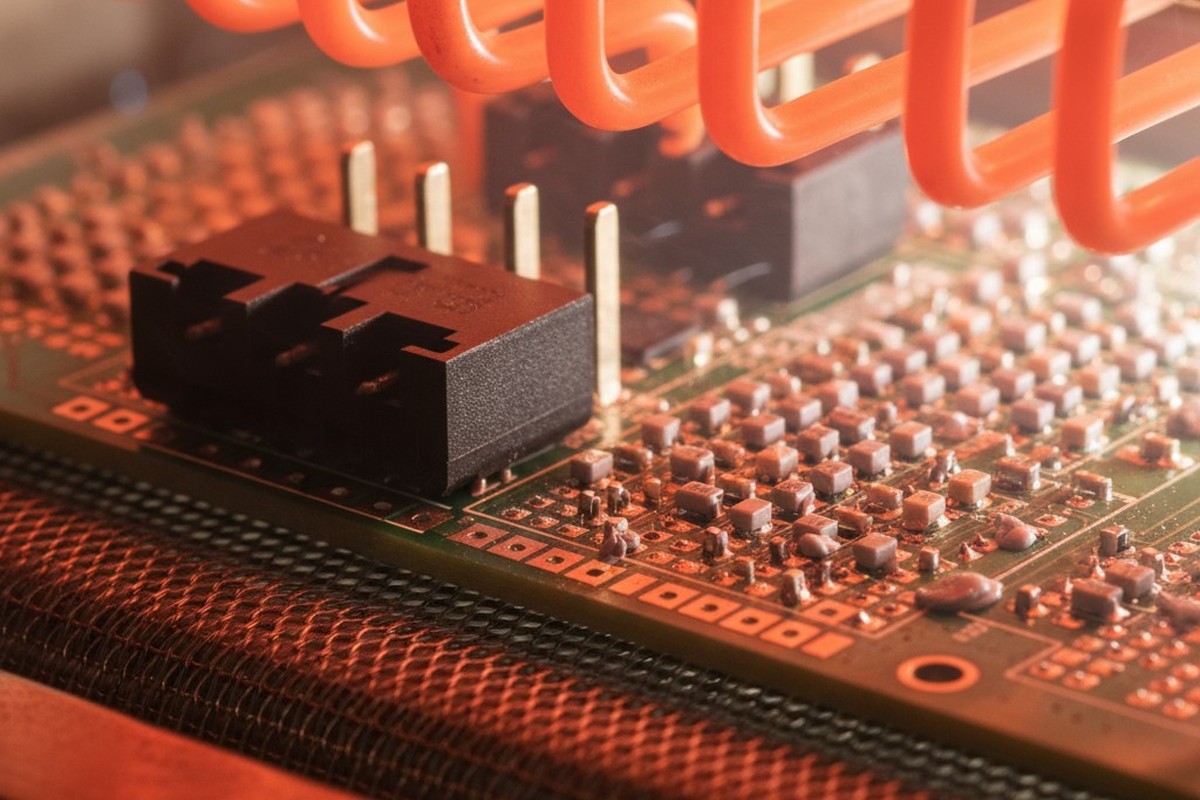
This waste isn’t the result of insufficient diligence or poorly calibrated equipment. It is the predictable consequence of applying a theoretical profile to an assembly that violates its core assumption: uniform thermal mass. The textbook profile was never designed for a board carrying both a massive power connector and a grid of 0402 resistors. It assumes a homogeneous thermal load that real products rarely exhibit. When thermal mass is uneven, a single profile cannot satisfy the conflicting process windows of heavy and light components. Optimizing for one guarantees failure on the other.
The solution isn’t better guesswork. It’s a shift to data-logged profiling, disciplined oven mapping, and a sober assessment of when a nitrogen atmosphere is truly warranted. These practices collapse the iteration loop by frontloading measurement and respecting the physics of heat transfer. They replace the week of trial and error with a methodology that works on the first run.
The Week You Lose Chasing the Textbook Profile
The textbook reflow profile is seductive in its simplicity: a controlled ramp to activate the flux, a soak to equalize temperature, a spike above liquidus to wet the solder, and a controlled cooldown to form the joint. The curve is smooth, the phases are distinct, and the theory is sound. It feels engineered. It feels safe. And it is the cause of a week of wasted effort.
The workflow it generates is anything but safe. An initial profile is programmed based on the paste manufacturer’s recommendation, itself an idealization that specifies nothing about component density or copper weight. The board is run. Inspection reveals a familiar catalogue of defects: tombstoning on small passives near the edge, poor wetting on a large connector’s ground pins, or worse, lifted pads from thermal shock. So the curve is adjusted. The soak is lengthened to give the heavy component more time to heat up. The board is run again. Now the small components are scorched. Another adjustment. Another run. By Friday, the oven profile is a Frankenstein of compromises, each zone temperature a negotiated settlement between contradictory demands.
The persistence of this approach isn’t due to ignorance. It’s taught in every assembly course, published on every solder paste datasheet, and embedded in the mental model of what profiling is supposed to be. The assumption that a single curve can be optimized for an entire board is rarely questioned because it is rarely stated. It is simply the way it’s done.
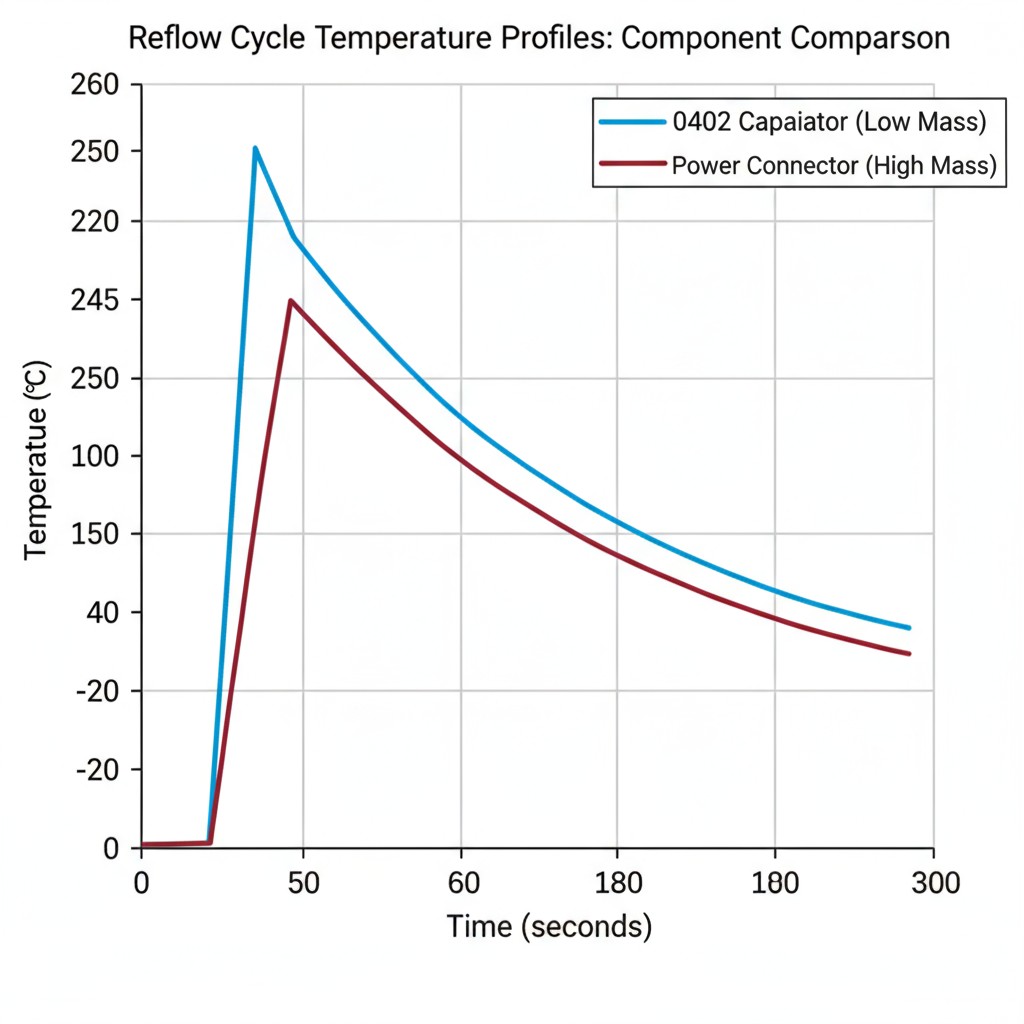
This assumption is a category error. The textbook profile was derived for simple assemblies where thermal mass is controlled. Real production boards are thermally chaotic. A backplane with a dense connector field and flooded ground planes presents a thermal sink that needs 30 seconds to reach soak temperature. The 0402 capacitors 50 millimeters away, sitting on isolated pads, reach that same temperature in eight seconds. No single ramp rate or soak duration can satisfy both. The textbook doesn’t acknowledge this conflict because the textbook doesn’t model it.
Why Thermal Mass Kills One-Size-Fits-All Profiles
The Physics of Uneven Heating
In reflow, thermal mass is a component’s capacity to absorb and hold heat. A large copper-and-plastic connector has high thermal mass; it heats up slowly and resists temperature changes. A tiny ceramic capacitor has low thermal mass; it responds almost instantly to the oven’s environment. These two parts will never heat at the same rate.
Heat transfer in a convection oven is driven by forced air. The rate at which a component absorbs energy depends on its surface area, thermal conductivity, and the temperature difference between it and the surrounding air. A large connector with significant mass but limited exposed surface area heats sluggishly. A small passive with a high surface-area-to-mass ratio heats rapidly. The board itself, especially areas with heavy copper pours, acts as a thermal reservoir that further complicates the heating rate of nearby components.
The result is a board in thermal disarray. At any given moment, components are at wildly different temperatures. When the small passives are at 200°C and ready for the spike to liquidus, the heavy connector may still be at 160°C. When the oven is cranked up to give that connector enough energy to reach peak temperature, the small passives are subjected to an extended, damaging dwell time above liquidus.
The Conflicting Process Windows
Every component has a process window—a range of time and temperature that produces a reliable solder joint without causing damage. For a small 0402 resistor, that window is narrow; it can tolerate a brief spike above liquidus, but extended heat will crack its body or degrade its terminations. For a large connector, the window is defined by the minimum time needed to wet its massive pins and the maximum time before its plastic housing deforms.
A single reflow profile is an attempt to find a compromise that keeps all components within their respective windows. When thermal mass is uneven, that compromise does not exist.
Consider a board with a 40-pin power connector and a field of small passives. The connector demands a long soak and a sustained peak temperature. Programming the oven for this guarantees the passives will be overcooked. Backing off the profile to protect the passives guarantees cold joints on the connector.
The defects are predictable. Tombstoning occurs when one end of a passive reflows before the other, allowing surface tension to pull it vertical—a direct result of a profile too aggressive for low-mass parts. Cold solder joints on large components are the opposite problem: the component’s thermal mass soaked up all the heat before the solder could properly wet the lead. Trying to fix one defect reliably produces the other. This isn’t a tuning problem; it’s a fundamental mismatch between the single-curve paradigm and thermal reality.
The Data-Logged Profiling Discipline
The alternative to assuming a profile will work is to measure if it does. Data-logged profiling attaches thermocouples directly to the components at the thermal extremes of the board: the largest, highest-mass part and the smallest, lowest-mass part. Running the board through the oven records the actual temperature each component experiences over time. This gives you a factual account of what is happening, not a theoretical prediction.
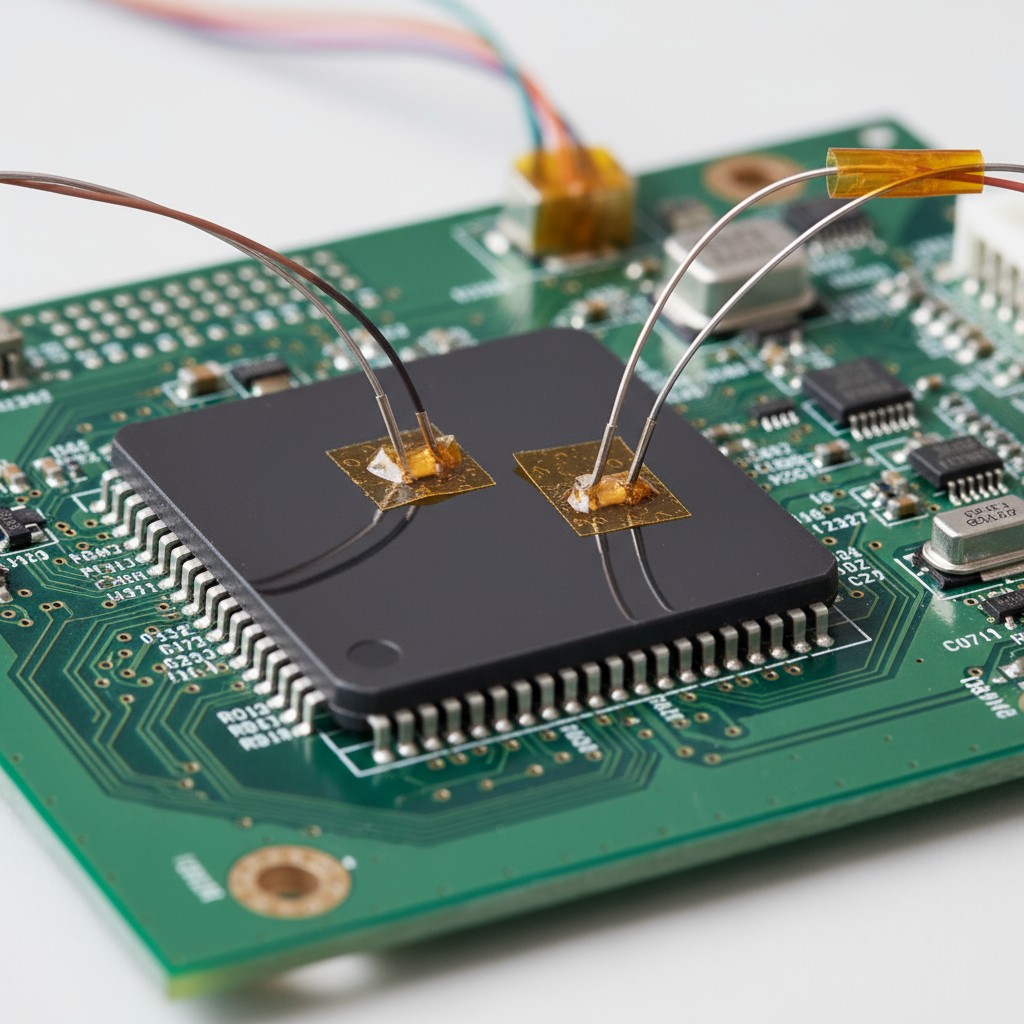
The value here isn’t a prettier curve. It’s the unambiguous revelation of where process windows are being violated. When the data shows the small passive hits 250°C while the large connector is still struggling at 210°C, the guesswork stops. The conflict is quantified. The decision becomes one of prioritization. Often, the heavy component must dictate the profile, and the lighter components must be protected by other means, like board placement or zone pre-heating.
Data-logged profiling also demolishes the false confidence that comes from measuring the oven’s air temperature or using a bare board. Air temperature tells you what the oven is doing, not what the components are feeling. A bare board has no thermal mass variation, making its profile an idealized fiction. Only component-level measurement captures the truth. This discipline requires an upfront investment, but that cost is recovered the first time an NPI doesn’t need five iteration runs.
The Nitrogen Question No One Asks Correctly
Nitrogen atmosphere during reflow is specified with remarkable consistency and questioned with remarkable rarity. The assumption is that an inert environment is always better. The reality is more conditional. Nitrogen inhibits oxidation of molten solder, which is only beneficial when the flux chemistry is too weak to do the job on its own or the board’s surface finish is especially sensitive.
When nitrogen actually matters: No-clean fluxes have lower chemical activity. On finishes like bare copper or ENIG, where oxides form rapidly at reflow temperatures, the flux may not be able to clean the surface before the solder wets. Here, nitrogen provides a meaningful process margin.
When nitrogen is waste: Aggressive, water-soluble fluxes are designed to power through oxides. Running them under nitrogen provides no additional benefit. Likewise, hot air solder leveling (HASL) finishes are inherently oxide-free and gain nothing from an inert atmosphere. Specifying nitrogen in these cases adds cost and complexity with no measurable improvement.
The question is not whether nitrogen is good, but whether your specific combination of flux and surface finish presents an oxidation challenge the flux cannot handle alone. This is a materials engineering decision, not a blanket specification.
One-and-Done Oven Mapping
Oven mapping characterizes the temperature uniformity and airflow of your oven. A test board gridded with thermocouples is run through the process, revealing hot and cold zones across the conveyor. This data allows you to place boards in the optimal position and adjust zone setpoints to compensate for the oven’s unique thermal signature.
The discipline is to do this thoroughly, once, and treat the resulting data as ground truth for all subsequent work. The map isn’t repeated for every new board. Instead, it informs the initial profile for every NPI. You already know the left side of the conveyor runs 10 degrees hotter than the right, so you make the adjustment before the first board ever goes in.
This eliminates the iterative rediscovery of the oven’s quirks. It makes oven characterization a prerequisite, not an afterthought. The time invested in a comprehensive mapping study is a few hours. The time saved over a year of NPIs is weeks.
Building a Profiling Protocol That Respects Physics
Rejecting textbook orthodoxy in favor of measurement leads to a protocol that frontloads data capture. It doesn’t aim for a perfect curve. It aims for a process window that produces acceptable joints on every component—a different and more achievable goal.
The protocol:
- Map the oven. If it hasn’t been done, characterize its thermal uniformity. Document hot spots, cold spots, and zone-to-zone offsets.
- Identify thermal extremes. Select the largest, heaviest component and the smallest, lightest component on your board. These are your sentinels.
- Attach thermocouples. Instrument the sentinel components and run the board using an initial profile based on paste data and your oven map.
- Review the data. Check the logged temperature curves. Did both sentinels stay within their process windows? If not, adjust zone setpoints or conveyor speed.
- Confirm. Run one more profile with the adjusted settings to verify both sentinels are in spec.
- Validate. Inspect the solder joints on the sentinels and a sample of other components. If they are acceptable, lock the profile. If defects remain, the problem isn’t the profile; it’s an upstream design issue that more iteration won’t solve.
This protocol uses real data to guide decisions and limits the iteration loop to a single confirmation run. The time saved is the direct result of refusing to guess when you can measure.
